
The Best Momentum Indicators for NinjaTrader
The Momentum Indicator is one of the most popular tools for trading stocks and futures. No wonder, as it offers a great way to get an accurate grip on the rate of fluctuation of your trading stock. This technical analysis tool is often combined with other indicators like Trend Indicators or Reversal Indicators. Devside Trading makes measuring momentum easy and convenient. Our Momentum Indicators for the popular trading platform NinjaTrader have been tried and tested by many day traders and brokers, as we are part of the NinjaTrader Ecosystem. Now we offer the best indicators with extra features to put you ahead in your day-to-day trading. Learn more about our accurate indicators and how they benefit your trade right here!
-
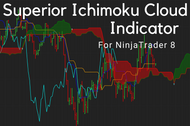
Ichimoku Cloud Superior
 Devside Trading
- Regular price
- $199.00
- Sale price
- $199.00
- Regular price
-
- Unit price
- per
Sold out -
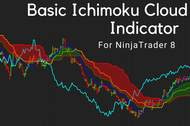
NinjaTrader Ichimoku Cloud Basic
 Devside Trading
- Regular price
- $19.00
- Sale price
- $19.00
- Regular price
-
$39.00 - Unit price
- per
Sold out -
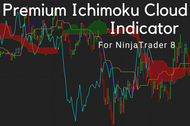
NinjaTrader Ichimoku Cloud Premium
 Devside Trading
- Regular price
- $59.00
- Sale price
- $59.00
- Regular price
-
$119.00 - Unit price
- per
Sold out -
Stochastic Momentum Index
 Devside Trading
- Regular price
- $0.00
- Sale price
- $0.00
- Regular price
-
- Unit price
- per
Sold out -
Stochastic Oscillator Superior
 Devside Trading
- Regular price
- $99.00
- Sale price
- $99.00
- Regular price
-
$159.00 - Unit price
- per
Sold out


What are Momentum Trading Indicators?
Momemtum Indicators are technical analysis tools for trading. Often abbreviated as MOM Indicators, they are designed to support other indicators to get a more accurate reading on the time frame of a change in the market price. With a Momentum Indicator you can better judge the strength of a bullish or bearish market. Because upwards trends are more common in trading, Momentum Indicators are more reliable in judging momentum in bullish markets.
The formula for stock momentum is simple: Divide the current closing price by the closing price of a previous period on the same trend and multiply by 100. Momentum should be tracked hourly or daily for traders to be able to see when a divergence is taking place. Usually a trend line will build momentum for several periods. Market noise may make it difficult to judge whether a trend is going strong or is about to turn.
Keep Track of Divergences with a Stock Momentum Indicator
The Momentum Indicator in a strong trend will follow the movement of the market price. When the indicator stops following the downward trend and is instead turning to an upwards movement, this divergence signal will alert you that the strength of the movement is on the decline. It indicates that the market price will turn from bearish to bullish or slow down. On the other hand, if the upward trend and momentum diverge, with the Momentum Indicator going lower, we speak of a bullish divergence. As the financial market is moving at a fast rate and a divergence can happen any time, it is vital for your trading strategy that you are able to see changes as soon as they happen. A Momentum Indicator with proper smoothing and signal alerts is therefore a great tool to keep track of those market changes.
One common Momentum Indicator is the Relative Strength Indicator, or RSI. It was developed by J. Wallace Wilder in the 1970s. Our QQE Indicator is an enhanced version of the RSI, providing a 14-period RSI with plot smoothing via a 5-period EMA. The RSI helps you spot overbought and oversold stocks. If the RSI indicator indicates that a market price is oversold than you should get ready to buy. If the RSI signals an overbought asset, traders can make a profit by selling stock. The RSI Oscillator swings between 0 and 100. If the RSI chart signals an index above 70 it indicates overbought stock, below 30 it signals oversold assets.
The Benefits of a NinjaTrader Momentum Indicator
NinjaTrader is one of the most popular platforms for trading futures. Whether you are a day trader or a broker: Our Momentum Indicators for NinjaTrader 8 will help you get ahead in the market. They are fully compatible with the newest NinjaTrader 8 Software and have been tested by traders in the NinjaTrader community with great results. Get your own NinjaTrader Momentum Indicator from Devside Trading and benefit from these great features:
- Custom sound alerts & alerts via e-mail or on our Trado Alerts app
- Plot smoothing and bar coloring
- Set sell/buy signal lines according to your preference
- Get accurate stochastic reading for momentum
- Eliminate false swings
- Great for futures, equities and forex trading
Only the Best: Devside Trading Momentum Indicators for NinjaTrader 8
Here at Devside Trading we work tirelessly to develop the best indicators for NinjaTrader that give you the features you need for a great trading strategy. Learn more about our Momentum Indicators to find the analysis tool that fits your trading style.
 The Stochastic Oscillator
The Stochastic Oscillator is a classic Momentum Indicator. Developed in the 1950s by George Lane, traders use it to measure oversold and overbought conditions. The Momentum Indicator compares the current closing time of an asset to a range of closing prices over a certain period of time. With values ranging from 0 to 100 this indicator is usually set to plot a signal line at 20 and 80 to indicate support and resistance. You can easily reduce the sensitivity to keep out the noise by adjusting the tracking periods.
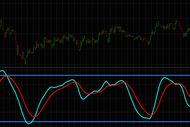
 The Stochastic Momentum Index
The Stochastic Momentum Index, or SMI, is a newer version of the stochastic oscillator. The SMI is used to spot overbought and oversold signal lines. If you combine it with a Volume Indicator, it is a powerful analysis tool to track momentum. The numbers of the SMI can oscillate between +100 and -100. Two lines, The main %K-line and the secondary %D-Line, are shown on the plot. The SMI measures the distance of the current price to the median price range of an asset. The two lines signal a divergence.
Eliminate falls swings with this improved version of Blau’s Double Smooth! If the SMI refrains from plotting a new low while the moving average of the trend line reaches a new lowest low the signal tends towards a buying divergence. If the trend line climbs to a new high with the SMI falling behind, a selling divergence is indicated.
Ichimoku Cloud Indicator

The Ichimoku Cloud Indicator is a versatile indicator that can be used for many aspects of analyzing trending markets. While it might look intimidating for first-time traders, the trend lines and spans allow for a coherent picture when analyzing the financial market. The Ichimoku Cloud Indicator is more than a simple Momentum Indicator. It combines trend directions as well as trend strength and makes resistance zones visible on the chart. Download our Superior Ichimoku Cloud Indicator Superior today for great smoothing, bar coloring and cloud displacement that lets you project asset spans into the future!
For the Best Momentum Indicator: Download Your Indicator from Devside Trading Today!
Devside Trading provides great tools for technical analysis for day traders and brokers trading on NinjaTrader 8. Get the best Indicators with convenient features that make your trading days easier. Take a look at the full list of our NinjaTrader Indicators to pick and choose the best indicators for your strategy: Moving averages, Trend Reversal Indicator, Momentum Indicators, Volume Indicators and more.
Are you a pro looking for something more? Contact us for a Custom Indicator for NinjaTrader 8! We are looking forward to making your individual tool work for you.
Looking for more? We also have an exciting NinjaTrader App and e-mail share service. Need Help activating your purchased downloads or using your Momentum Indicator in our App? Check out our helpful guide about activating your product! Of course, your personal details will only be collected if you freely disclose them to us, e.g. while ordering an indicator, opening a membership account or subscribing to our newsletter.
Feel free to contact us using our contact form, if you have any further questions about our indicators — or you can chat with us directly!